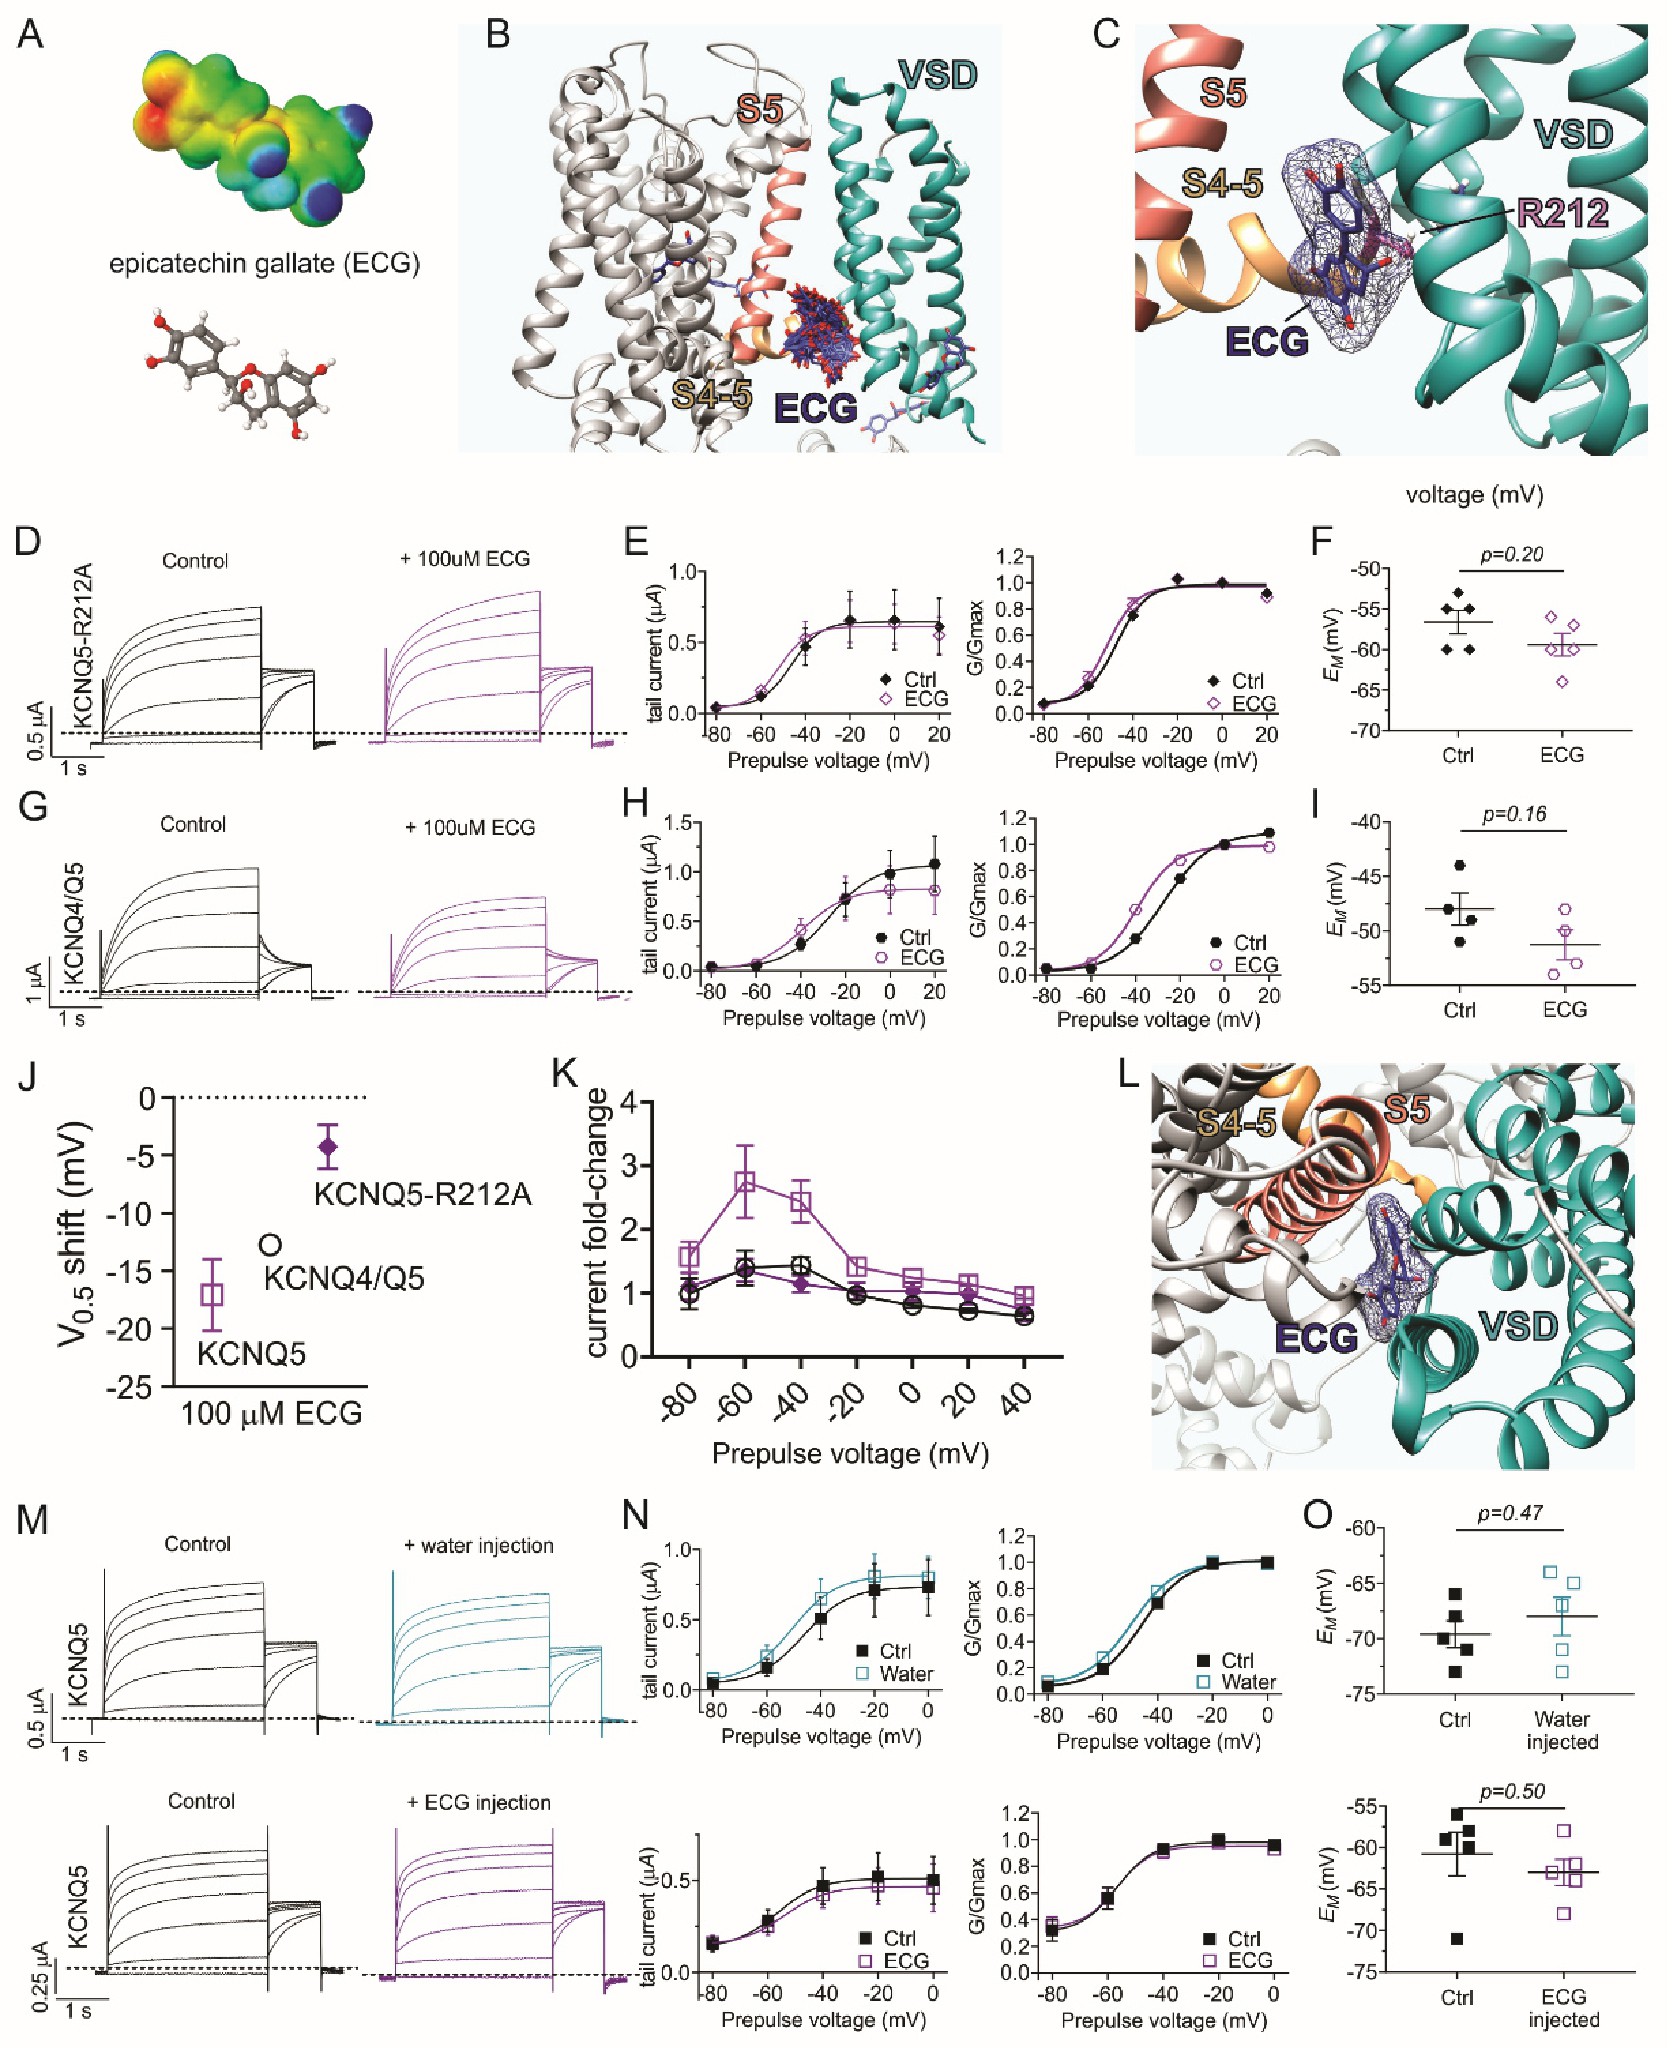
Fig. 7. Epicatechin gallate requires KCNQ5-R212 for current augmentation. All error bars indicate SEM. A: Electrostatic surface potential plot (red, negative; blue, positive) and molecular structure od epicatechin gallate (ECG). B: Unbiased results showing all predicted ECG (blue) docking poses on the transmembrane region of a neuronal KCNQ structural model based on the Xenopus KCNQ1 cryo-EM structure. C: Close-up of the model in panel B showing the ECG (blue) pose with the most negative predicted ΔG score, close to the KCNQ5-R212 equivalent position (pink). D: Mean KCNQ5-R212A traces in the absence (Control) and presence of 100 µM ECG (n = 5). E: Left, mean tail current; right, mean normalized tail current (G/Gmax) verses prepulse voltage for traces as in D (n = 5). F: Scatter plot of unclamped membrane potential (EM) for cells as in D (n = 5). Statistical analyses by two-way ANOVA. G: Mean KCNQ4/Q5 traces in the absence (Control) and presence of 100 µM ECG (n = 4). H: Left, mean tail current; right, mean normalized tail current (G/Gmax) verses prepulse voltage for traces as in G (n = 4). I: Scatter plot of unclamped membrane potential (EM) for cells as in G (n = 4). Statistical analyses by two-way ANOVA. K: ΔV0.5activation of KCNQ5, KCNQ4/Q5, and KCNQ5-R212A induced by 100 µM ECG (n = 4-5). J: Tail current fold-change of KCNQ5, KCNQ4/Q5, and KCNQ5-R212A induced by 100 µM ECG (n = 4-5). L: A view from the extracellular side of the predicted ECG binding site in panel C. M: Mean KCNQ5 traces in the absence (Control) and presence of injected ECG (50 nl, 2 mM in water) or water as indicated (n = 5). N: Left, mean tail current; right, mean normalized tail current (G/Gmax) verses prepulse voltage for traces as in M (n = 5). O: Scatter plot of unclamped membrane potential (EM) for cells as in M (n = 5). Statistical analyses by two-way ANOVA.